Note: This document is for an older version of GRASS GIS that has been discontinued. You should upgrade, and read the current manual page.
NAME
r.niche.similarity - Computes niche overlap or similarityKEYWORDS
raster, niche modellingSYNOPSIS
Flags:
- -i
- I niche similarity
- -d
- D niche similarity
- -c
- Correlation
- -m
- remove NA cells
- --overwrite
- Allow output files to overwrite existing files
- --help
- Print usage summary
- --verbose
- Verbose module output
- --quiet
- Quiet module output
- --ui
- Force launching GUI dialog
Parameters:
- maps=name[,name,...] [required]
- Input maps
- output=name
- Name of output text file
- nprocs=integer
- Number of threads for parallel computing
- Default: 1
Table of contents
DESCRIPTION
Module r.niche.similarity computes two metrics to quantify niche similarity or overlap between all pairs of input raster layers.One is the niche equivalency or similarity for two species following Warren et al. (2008) based on Schoeners D (Schoener, 1968). This metric ranges from 0 to 1, representing respectively no overlap and an identical distribution.
The other is the niche overlap metric which indicates the niche overlap from predictions of species distributions with the I similarity statistic of Warren et al. (2009), which is based on Hellinger Distances (van der Vaart, 1998). The statistic ranges from 0 (no overlap) to 1 (the distributions are identical).
By default the results are written to screen, but they can also be written to a text file with two columns for the names of each pair of rasters, a third column for the type of statistic (D or I) and a fourth column for the D or I statistic.
Notes
This implementation is especially suitable if you are working with very large data sets. Results were checked against the nicheOverlap function in the dismo package for R.If any of the input maps include NODATA cells, these should normally not be included. To ensure this, the -m flag can be set to remove them. This mimics the default behaviour of the nicheOverlap function in the R dismo package. Depending on what the NODATA represents, an alternative approcah is to replace the NODATA with 0 values before running r.niche.overlap.
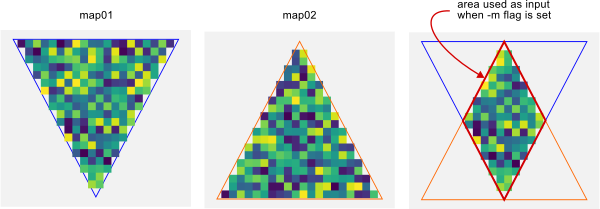
Figure 1. with the -m flag set, areas with NODATA in any of the input maps are ignored.
EXAMPLE
Create two random rasters# Set region g.region rows=18 cols=36 w=10 s=10 res=0.1 # Create rasters r1 and r2 r.mapcalc 'r1 = rand(0.0,1.0)' seed=0 r.mapcalc 'r1 = rand(0.0,1.0)' seed=1
# Create rasters r1 and r2
r.niche.similarity -i -d maps=r1,r2
REFERENCES
- Warren, D. L., Glor, R. E., & Turelli, M. 2008. Environmental Niche Equivalency Versus Conservatism: Quantitative Approaches to Niche Evolution. Evolution 62(11): 2868-2883
- Warren, D. L., R. E. Glor, and M. Turelli. 2010. ENMTools: a toolbox for comparative studies of environmental niche models. Ecography 33:607-611.
- Robert J. Hijmans, Steven Phillips, John Leathwick and Jane Elith (2013). dismo: Species distribution modeling. R package version 0.8-5. http://CRAN.R-project.org/package=dismo
- Christoph Heibl and Clement Calenge (2012). phyloclim: Integrating Phylogenetics and Climatic Niche Modeling. R package version 0.9-0. http://CRAN.R-project.org/package=phyloclim
AUTHOR
Paulo van Breugel, Ecodiv.earth, HAS green academy, Innovative Biomonitoring research group, Climate-robust Landscapes research groupSOURCE CODE
Available at: r.niche.similarity source code (history)
Latest change: Saturday Apr 12 06:10:01 2025 in commit: 453cfa2fcea17580814cac32bd92ec2fdab8bf3e
Main index | Raster index | Topics index | Keywords index | Graphical index | Full index
© 2003-2024 GRASS Development Team, GRASS GIS 8.3.3dev Reference Manual