NAME
g.gui.timeline - Allows comparing temporal datasets by displaying their temporal extents in a plot.KEYWORDS
general, GUI, temporal, plotSYNOPSIS
g.gui.timeline
g.gui.timeline --helpg.gui.timeline [-3] [inputs=name[,name,...]] [--help] [--verbose] [--quiet] [--ui]
Flags:
- -3
- Show also 3D plot of spatio-temporal extents
- --help
- Print usage summary
- --verbose
- Verbose module output
- --quiet
- Quiet module output
- --ui
- Force launching GUI dialog
Parameters:
- inputs=name[,name,...]
- Name of the input space time datasets
Table of contents
DESCRIPTION
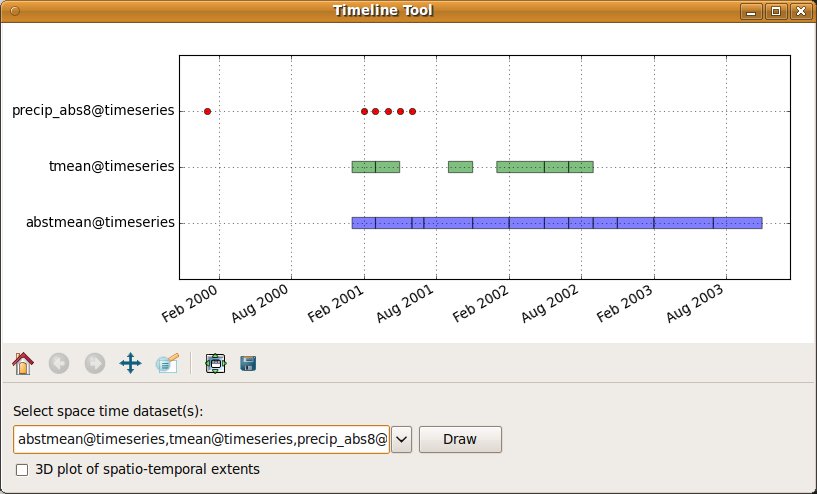
The Timeline Tool is a wxGUI component which allows the user to compare the extents of temporal datasets (strds, stvds, str3ds) in a plot.Supported features:
- temporal datasets with interval/point and absolute/relative time
- 2D plots - temporal extent
- 3D plots - spatio-temporal extent (matplotlib >= 1.0.0)
- pop-up annotations with basic metadata
NOTES
g.gui.timeline requires the Python plotting library Matplotlib.SEE ALSO
Temporal data processingwxGUI
wxGUI components
AUTHOR
Anna Kratochvilova, Czech Technical University in Prague, Czech RepublicSOURCE CODE
Available at: wxGUI Timeline Tool source code (history)
Latest change: Thu Feb 3 11:10:06 2022 in commit: 73413160a81ed43e7a5ca0dc16f0b56e450e9fef
Main index | GUI index | Topics index | Keywords index | Graphical index | Full index
© 2003-2022 GRASS Development Team, GRASS GIS 8.0.3dev Reference Manual