Note: This document is for an older version of GRASS GIS that has been discontinued. You should upgrade, and read the current manual page.
wxGUI Temporal Plot Tool
Table of contents
DESCRIPTION
The Temporal Plot Tool is a wxGUI component that queries and plots the values of a point, defined by a coordinate pair, in one or more temporal datasets (strds, stvds, str3ds).Supported features:
- temporal datasets with interval/point and absolute/relative time,
- pop-up annotations with values information,
- query and plot multiple points via the command line,
- zoom and pan,
- change labels to x and y axes,
- add title to the plot, and
- export the time series values to a CSV file.
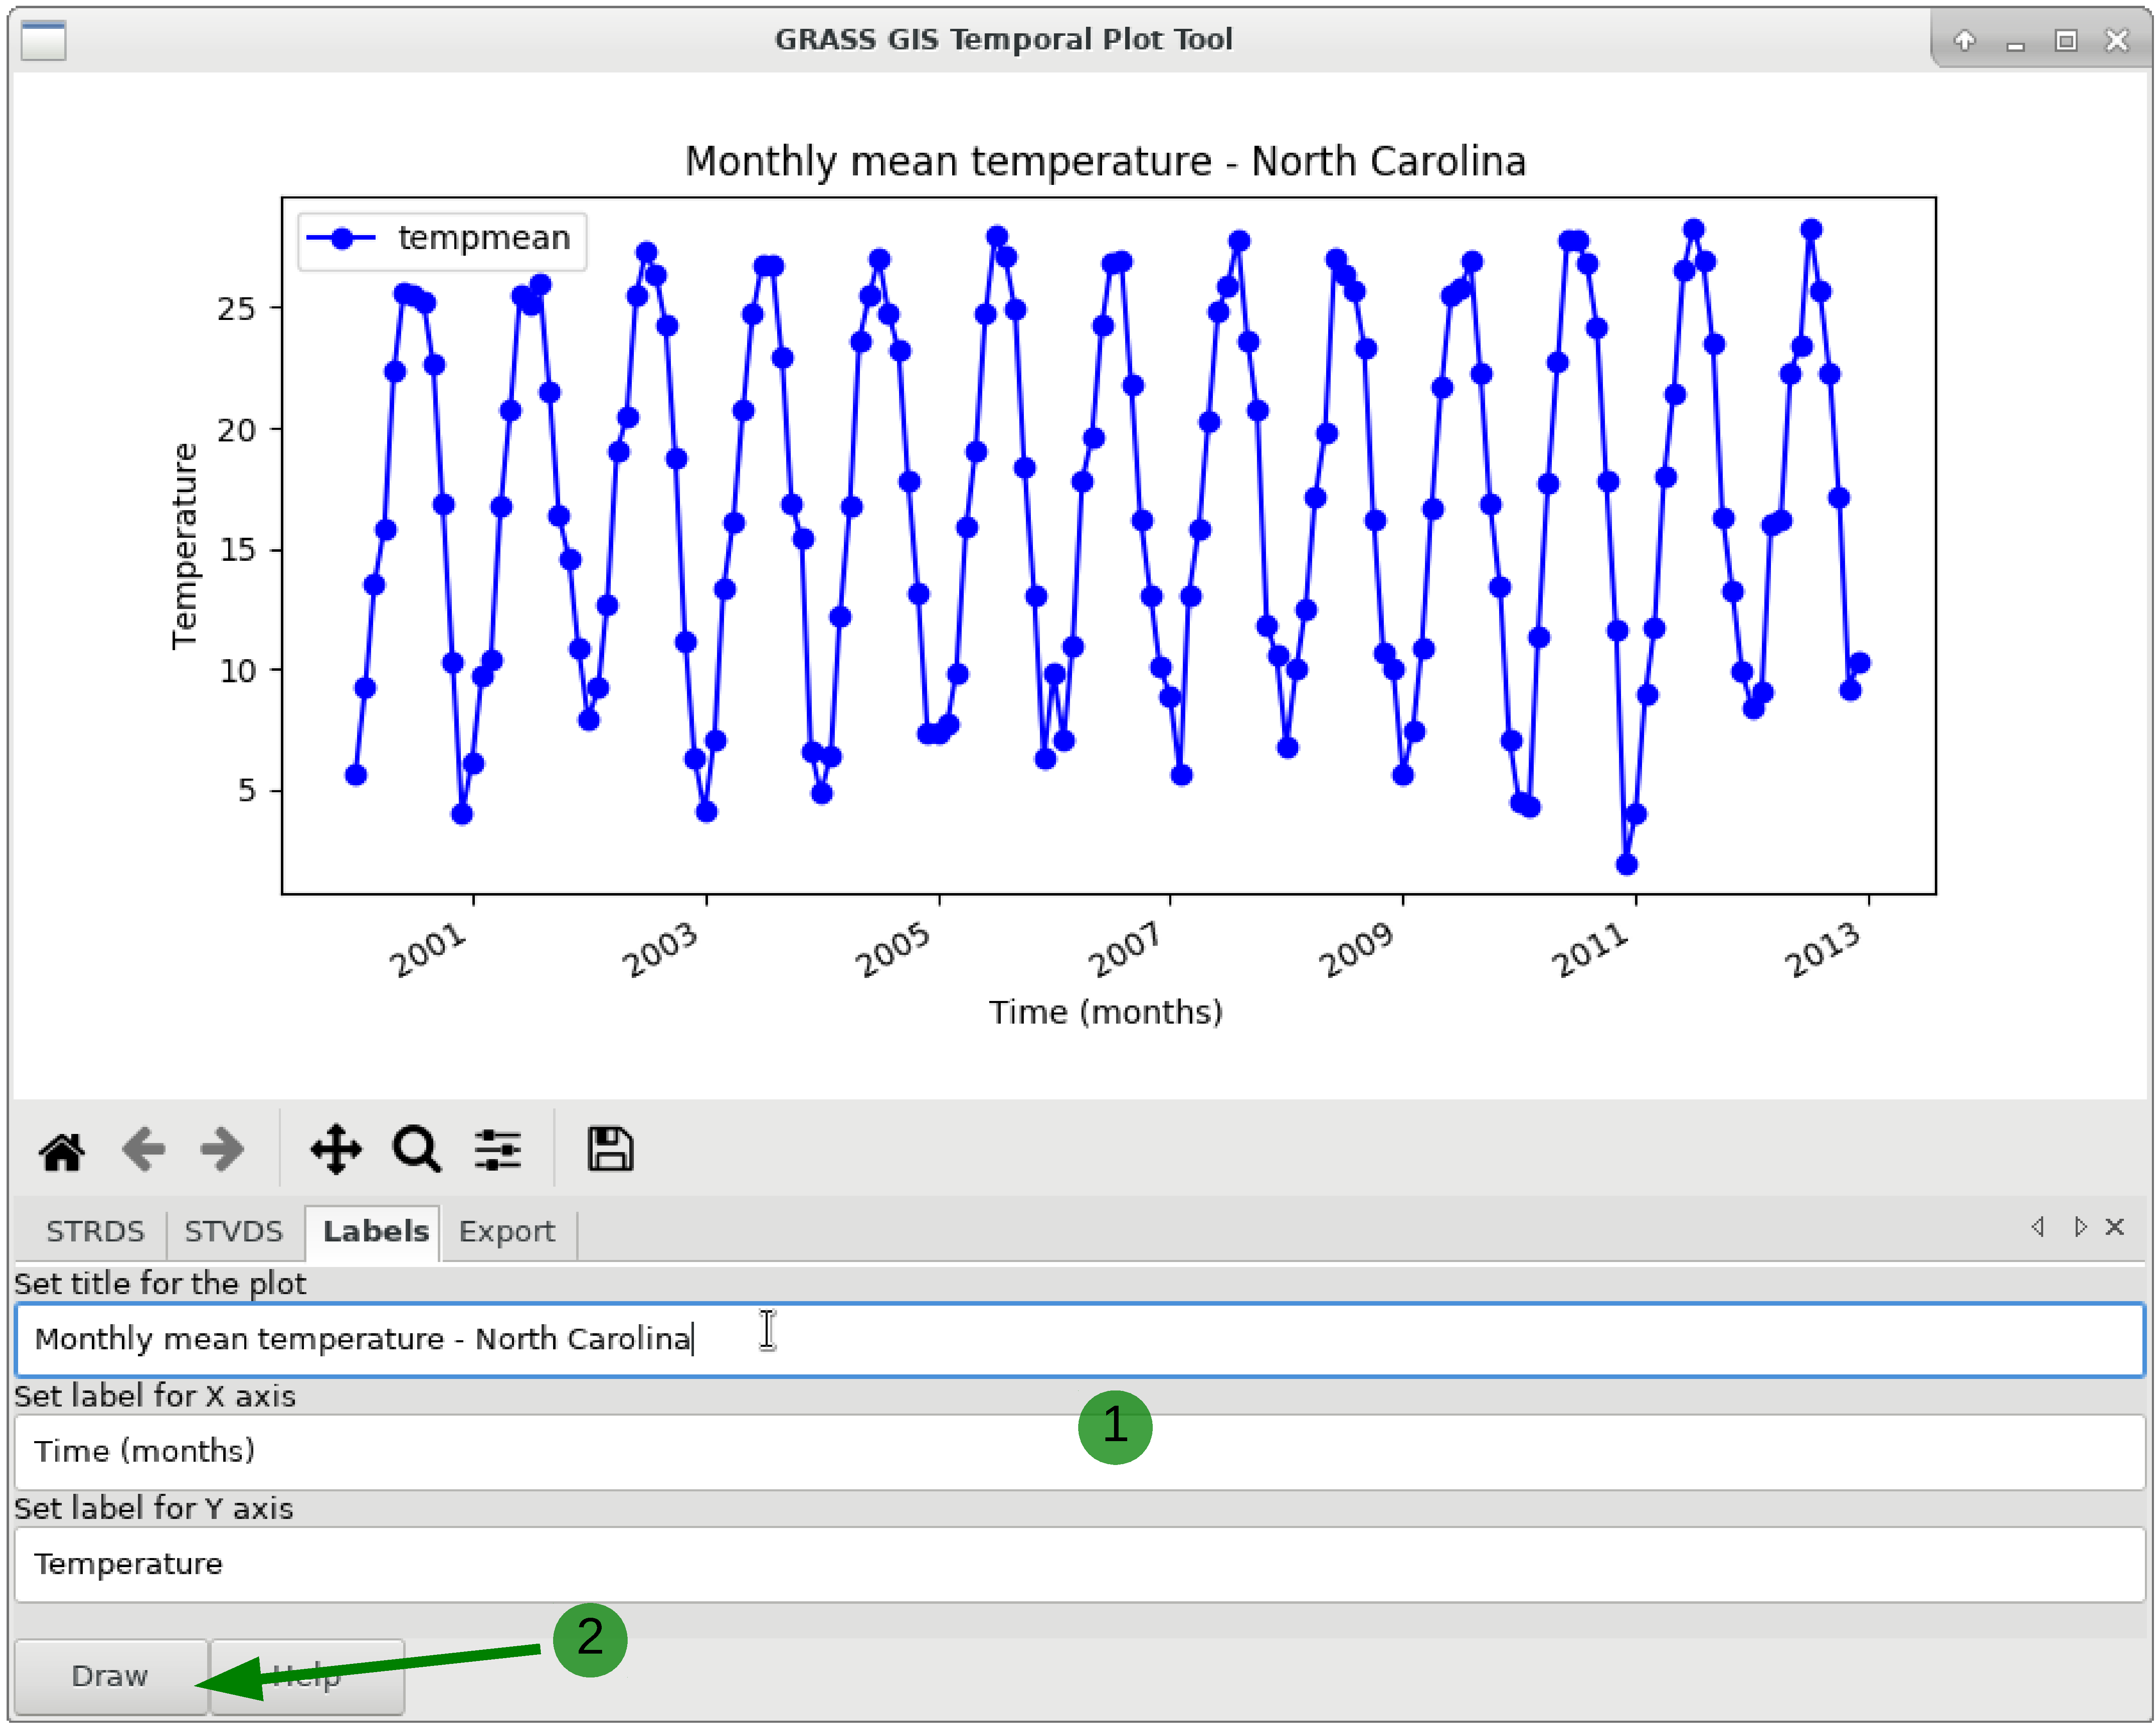
Figure: Temporal Plot Tool
Figure: Add title and labels to a time series plot
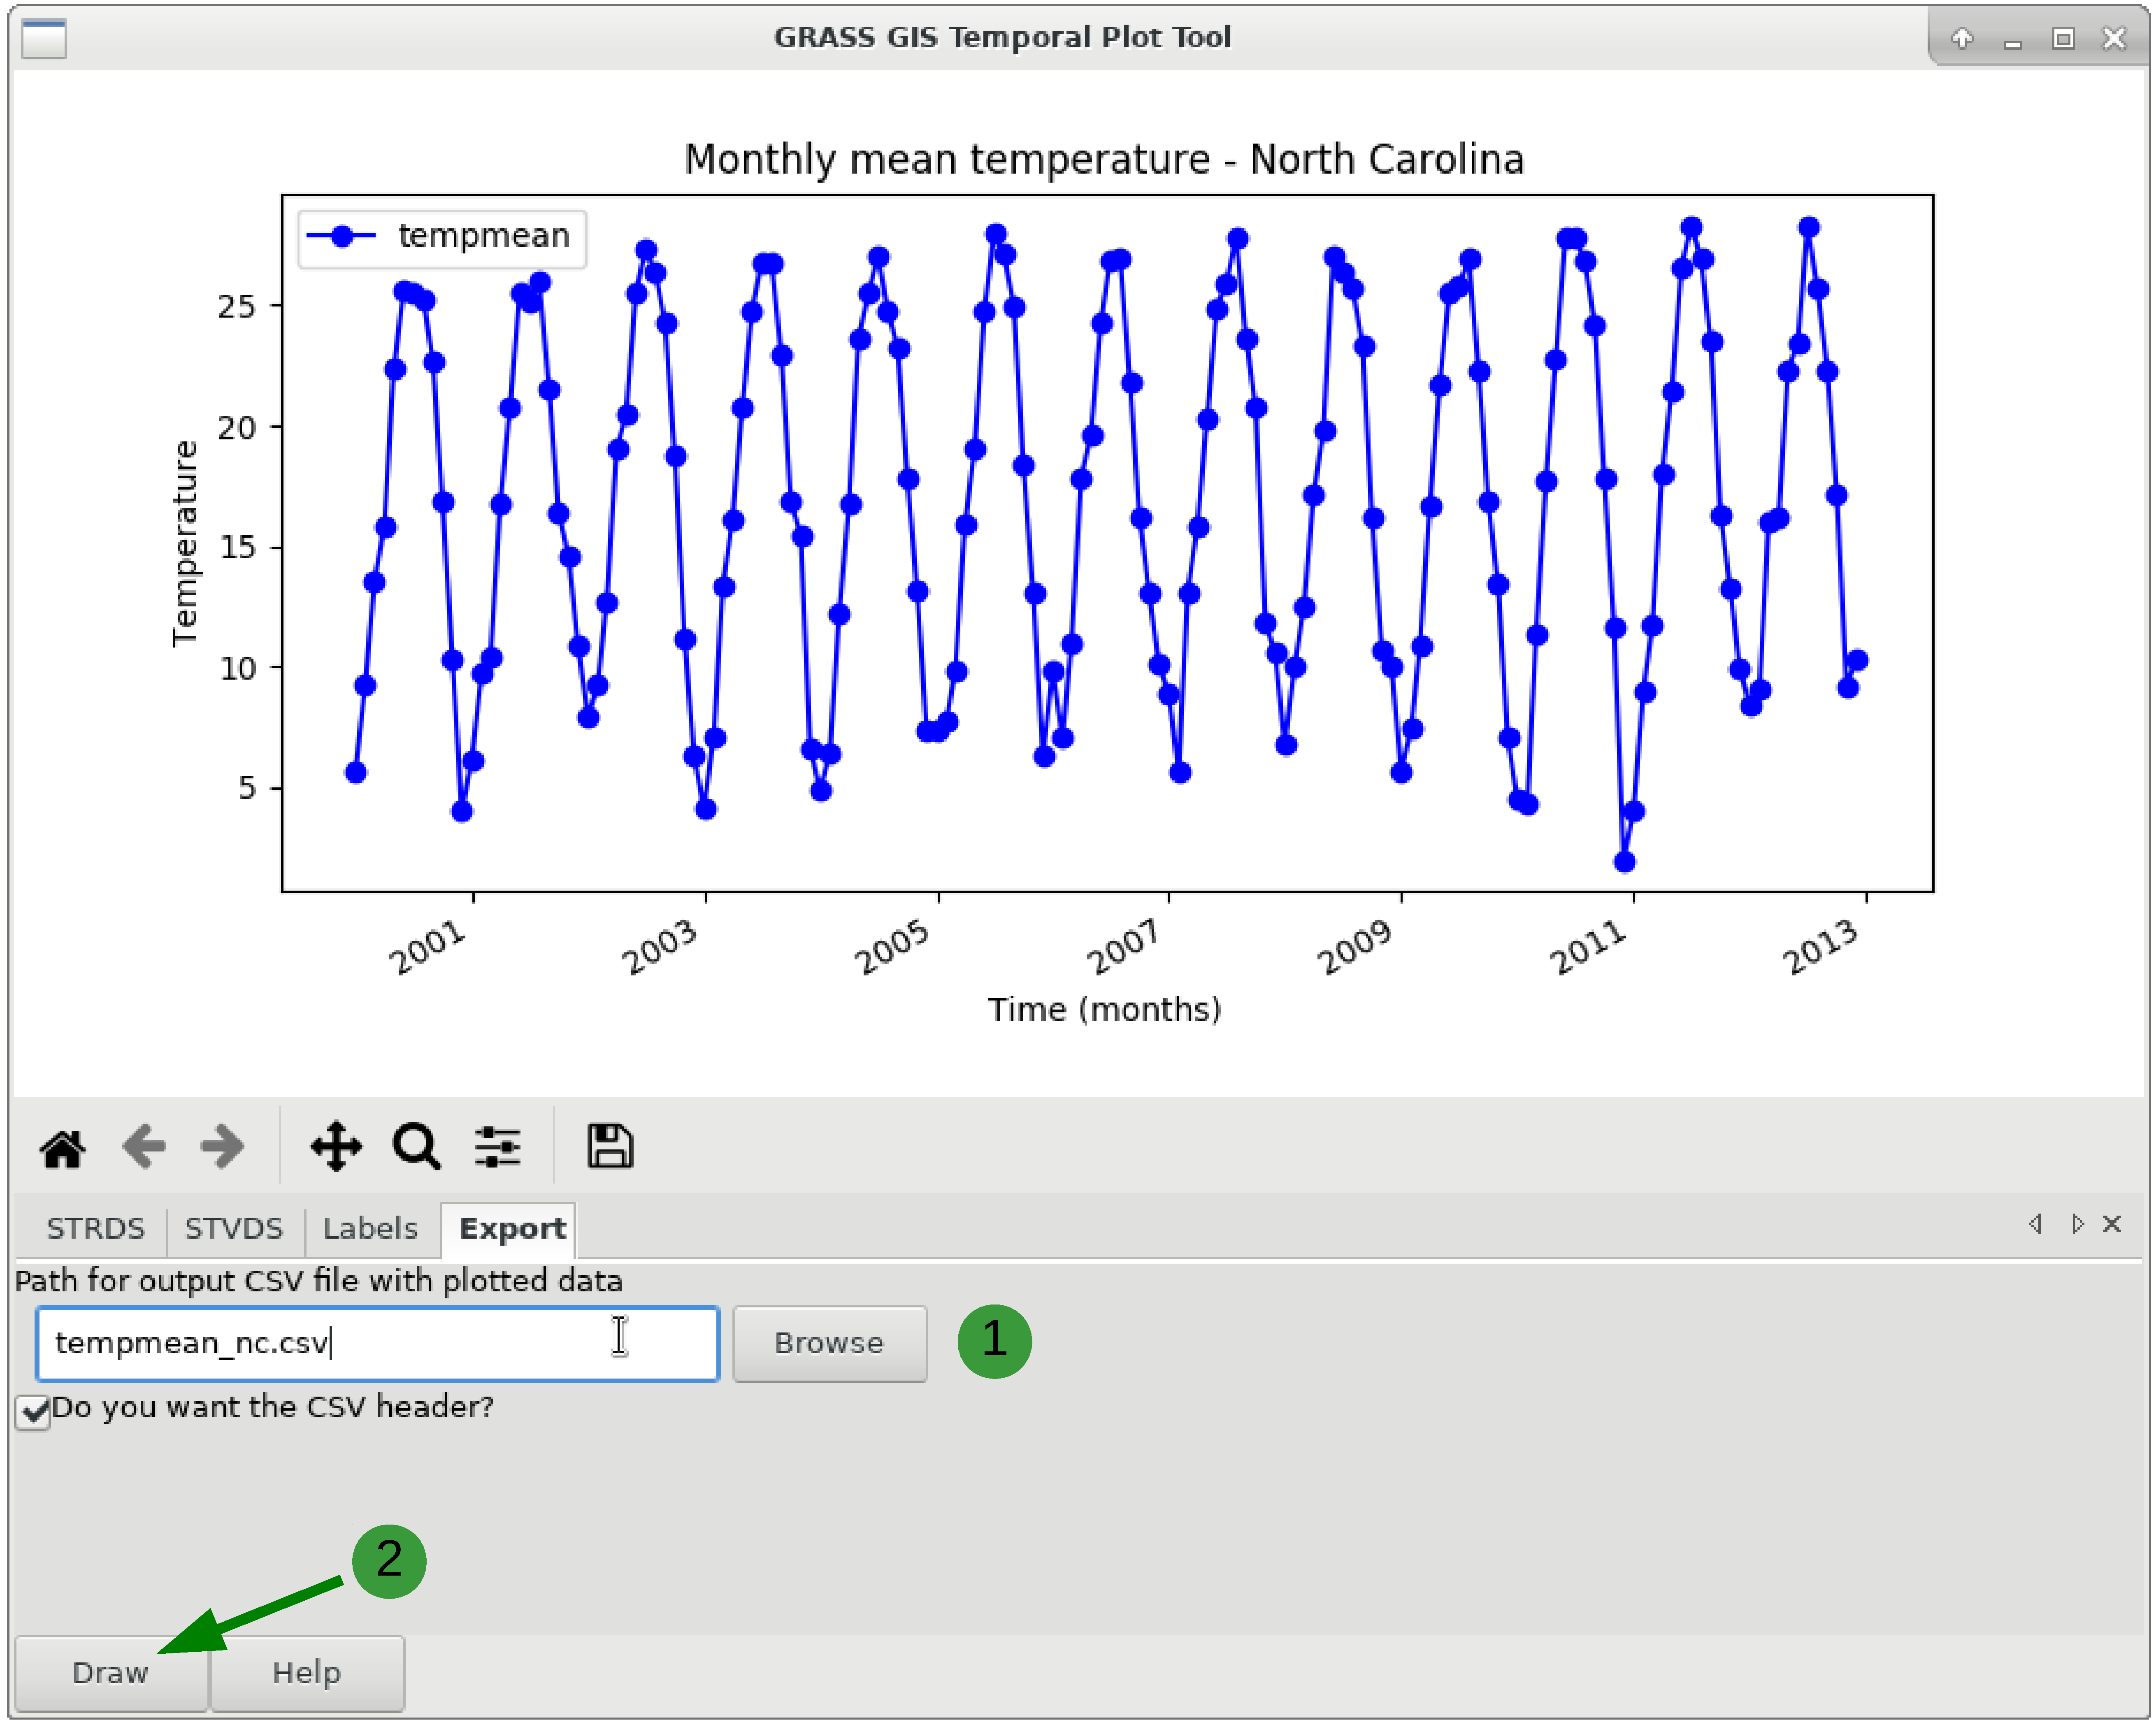
Figure: Export time series values to a text file
NOTES
g.gui.tplot requires the Python plotting library Matplotlib.SEE ALSO
Temporal data processingwxGUI
wxGUI components
AUTHOR
Luca Delucchi, Fondazione Edmund Mach, ItalySOURCE CODE
Available at: wxGUI Temporal Plot Tool source code (history)
Latest change: Saturday Jul 16 18:18:43 2022 in commit: effc544b795cef89a0c38628eee513eca82c266e
Main index | GUI index | Topics index | Keywords index | Graphical index | Full index
© 2003-2023 GRASS Development Team, GRASS GIS 7.8.9dev Reference Manual