Note: This document is for an older version of GRASS GIS that has been discontinued. You should upgrade, and read the current manual page.

NAME
r.clump - Recategorizes data in a raster map by grouping cells that form physically discrete areas into unique categories.KEYWORDS
raster, statistics, reclass, clumpsSYNOPSIS
Flags:
- -d
- Clump also diagonal cells
- Clumps are also traced along diagonal neighboring cells
- -g
- Print only the number of clumps in shell script style
- --overwrite
- Allow output files to overwrite existing files
- --help
- Print usage summary
- --verbose
- Verbose module output
- --quiet
- Quiet module output
- --ui
- Force launching GUI dialog
Parameters:
- input=name[,name,...] [required]
- Name of input raster map(s)
- output=name
- Name for output raster map
- title=string
- Title for output raster map
- threshold=float
- Threshold to identify similar cells
- Valid range: 0 = identical to < 1 = maximal difference
- Default: 0
- minsize=integer
- Minimum clump size in cells
- Clumps smaller than minsize will be merged to form larger clumps
- Default: 1
Table of contents
DESCRIPTION
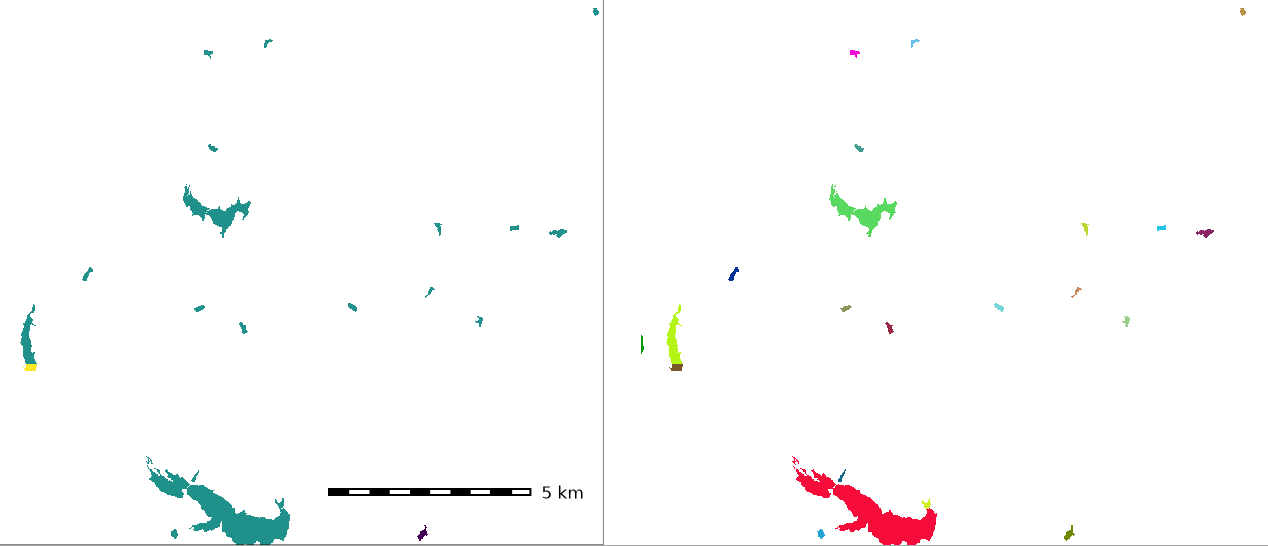
r.clump finds all areas of contiguous cell category values (connected components) in the input raster map. NULL values in the input are ignored. It assigns a unique category value to each such area ("clump") in the resulting output raster map.Category distinctions in the input raster map are preserved. This means that if distinct category values are adjacent, they will NOT be clumped together. The user can run r.reclass prior to r.clump to recategorize cells and reassign cell category values.
r.clump can also perform "fuzzy" clumping where neighboring cells that are not identical but similar to each other are clumped together. Here, the spectral distance between two cells is scaled to the range [0, 1] and compared to the threshold value. Cells are clumped together if their spectral distance is ≤ threshold. The result is very sensitive to this threshold value, a recommended start value is 0.01, then increasing or decreasing this value according to the desired output. Once a suitable threshold has been determined, noise can be reduced by merging small clumps with the minsize option.
r.clump can also use multiple raster maps of any kind (CELL, FCELL, DCELL) as input. In this case, the spectral distance between cells is used to determine the similarity of two cells. This means that input maps must be metric: the difference cell 1 - cell 2 must make sense. Categorical maps, e.g. land cover, can not be used in this case. Examples for valid input maps are satellite imagery, vegetation indices, elevation, climatic parameters etc.
NOTES
By default, the resulting clumps are connected only by their four direct neighbors (left, right, top, bottom). The -d flag activates also diagonal clump tracing.r.clump works properly with raster map that contains only "fat" areas (more than a single cell in width). Linear elements (lines that are a single cell wide) may or may not be clumped together depending on the direction of the line - horizontal and vertical lines of cells are considered to be contiguous, but diagonal lines of cells are not considered to be contiguous and are broken up into separate clumps unless the -d flag is used.
A random color table and other support files are generated for the output raster map.
EXAMPLES
Clumping of a raster map
Perform clumping on "lakes" map (North Carolina sample dataset) and report area sizes for each lake individually rather by waterbody type:g.region raster=lakes -p # report sizes by waterbody type r.report lakes units=h # clump per raster polygon r.clump lakes out=lakes_individual # report sizes by individual waterbody r.report lakes_individual units=h
Fuzzy clumping on Landsat bands
Perform fuzzy clumping on Landsat 7 2002 imagery (North Carolina sample dataset)
g.region raster=lsat7_2002_10 -p
r.clump in=lsat7_2002_10,lsat7_2002_20,lsat7_2002_30,lsat7_2002_40,lsat7_2002_50,lsat7_2002_70 \
        out=lsat7_2002_clump threshold=0.045

# reduce noise
r.clump in=lsat7_2002_10,lsat7_2002_20,lsat7_2002_30,lsat7_2002_40,lsat7_2002_50,lsat7_2002_70 \
        out=lsat7_2002_clump_min10 threshold=0.045 minsize=10

Figure: Fuzzy clumping on Landsat bands: original RGB composite (left), fuzzy clumped map (middle), and fuzzy clumped with minsize map (right)
SEE ALSO
r.average, r.buffer, r.distance, r.grow, r.mapcalc, r.mfilter, r.neighbors, r.to.vect, r.reclass, r.statistics, r.supportAUTHORS
Michael Shapiro, U.S. Army Construction Engineering Research LaboratoryMarkus Metz (diagonal clump tracing, fuzzy clumping)
SOURCE CODE
Available at: r.clump source code (history)
Latest change: Friday Jan 22 21:28:36 2021 in commit: d494dddc784a07e5f786667d94fef1d39196f68f
Main index | Raster index | Topics index | Keywords index | Graphical index | Full index
© 2003-2023 GRASS Development Team, GRASS GIS 7.8.9dev Reference Manual
