Note: This document is for an older version of GRASS GIS that will be discontinued soon. You should upgrade, and read the current manual page.
Note: This addon document is for an older version of GRASS GIS that will be discontinued soon. You should upgrade your GRASS GIS installation, and read the current addon manual page.
NAME
r.series.filter - Performs filtering of raster time series X (in time domain).KEYWORDS
raster, statistics, filterSYNOPSIS
Flags:
- -c
- Try to find optimal parameters for filtering
- -u
- Fit the result curve by upper boundary
- --overwrite
- Allow output files to overwrite existing files
- --help
- Print usage summary
- --verbose
- Verbose module output
- --quiet
- Quiet module output
- --ui
- Force launching GUI dialog
Parameters:
- input=string[,string,...] [required]
- Raster names of equally spaced time series
- result_prefix=string [required]
- Prefix for raster names of filtered X(t)
- method=string
- Used method
- Default: savgol
- winsize=integer
- Length of running window for the filter
- Default: 9
- order=integer
- Order of the Savitzky-Golay filter
- Default: 2
- opt_points=integer
- Count of random points used for parameter optimization
- Default: 50
- diff_penalty=float
- Penalty for difference between original and filtered signals
- Default: 1.0
- deriv_penalty=float
- Penalty for big derivates of the filtered signal
- Default: 1.0
- iterations=integer
- Number of iterations
- Default: 1
Table of contents
DESCRIPTION
r.series.filter is a module to filter raster time series X in time domain. It requires python-scipy (version 0.14 or later).-c: Find optimal parameters of used filter. The function to optimize depends on difference between original and filtered signals and on derivates of the filtered signal.
-u: Filter using upper boundary of the signal values (Useful for vegetation indexes filtering).
input: Raster names of equally spaced time series X.
result_prefix: Prefix for raster names of filterd X.
method: Filtering method. Implemented filters are Savitzky-Golay filter savgol and median filter median.
winsize: The length of the filter window. winsize must be a positive odd integer.
order: The order of the polynomial used to fit the samples. The order must be less than winsize (Savitzky-Golay only).
iterations: Number of filtering iterations.
opt_points: If -c is specifed, then random sample opt_points and use them in parameter optimization.
diff_penalty: Penalty for difference between original and filtered signals (see Notes).
deriv_penalty: Penalty for derivates of filtered signal (see Notes).
NOTES
X must be equally spaced time series. If the series isn't equally spaced, insert NULL raster maps into X.There is a procedure for searching for good filtering parameters: it uses opt_points random points and perfoms filtering in that points. The result of the filtering can be tested for quality. The quality function is a trade of two features: accuracy and smoothing. Accuracy can be estimated as the (abs) difference between original and filtered data, quality of smoothing can be estimated as absalute values of the derivates. So there are two parameters diff_penalty and deriv_penalty that can ajust the trade-of.
So the optimizing procedure performs loop over filtering parameters and calculates the next penalty function:
penalty = diff_penalty * sum(abs(Xi-Fi)) + sum(abs(dFi))
The optimal parameters are used for signal filtering in the whole region.
If -u flag is specifed, then filter uses Chen's algorithm (see link bellow). The algorithm is usefull for vegetation indexes filtering. It creates a curve that flows on upper boundary of the signal.
EXAMPLES
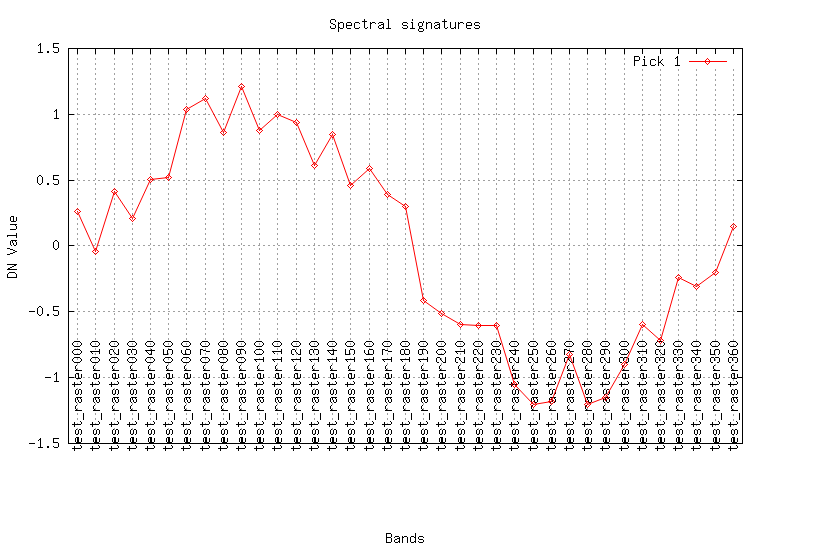
Create test data: X = sin(t) + E, where X is raster time series, E is a error term.for T in $(seq -w 0 10 360) do name="test_raster"$T r.mapcalc -s "$name = sin($T) + rand(-0.3, 0.3)" done
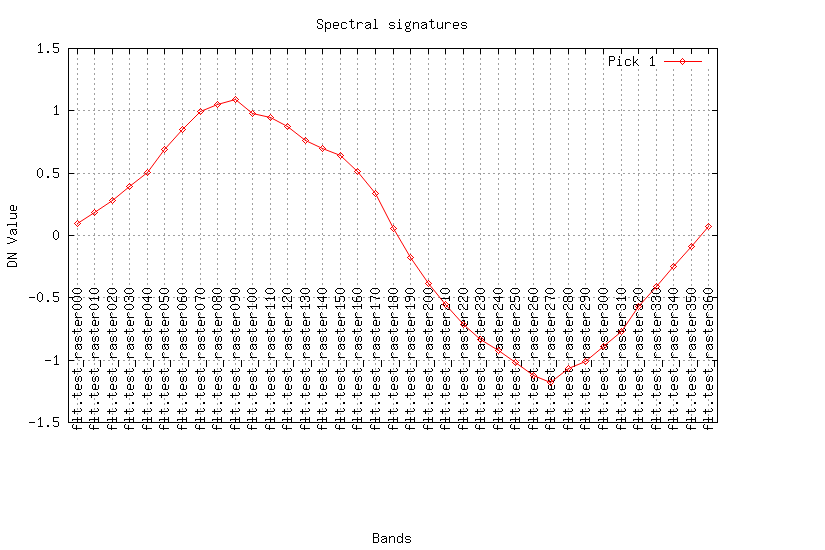
Create smooth raster series using Savitzky-Golay method:
maps=$(g.list rast patt="test_*" sep=,)
r.series.filter input=$maps result_prefix="flt." method=savgol winsize=9 order=2 --o
Look at the result (plot the curves for a pixel):
maps=$(g.list rast patt="test_*" sep=,)
fmaps=$(g.list rast patt="flt.*" sep=,)

eval $(g.region -cg)
i.spectral -g raster=$maps coor=$center_easting,$center_northing out=signal.png
i.spectral -g raster=$fmaps coor=$center_easting,$center_northing out=flt.png
REFERENCES
Chen, Jin; Jonsson, Per; Tamura, Masayuki; Gu, Zhihui; Matsushita, Bunkei; Eklundh, Lars. (2004). A simple method for reconstructing a high-quality NDVI time-series data set based on the Savitzky-Golay filter. Remote Sensing of Environment, 91, 332-344, doi:10.1016/j.rse.2004.03.014.SEE ALSO
r.regression.series, r.series, r.regression.line, g.listAUTHOR
Dmitry KolesovSOURCE CODE
Available at: r.series.filter source code (history)
Latest change: Monday Jun 28 07:54:09 2021 in commit: 1cfc0af029a35a5d6c7dae5ca7204d0eb85dbc55
Note: This document is for an older version of GRASS GIS that will be discontinued soon. You should upgrade, and read the current manual page.
Note: This addon document is for an older version of GRASS GIS that will be discontinued soon. You should upgrade your GRASS GIS installation, and read the current addon manual page.
Main index | Raster index | Topics index | Keywords index | Graphical index | Full index
© 2003-2023 GRASS Development Team, GRASS GIS 7.8.9dev Reference Manual