Note: This document is for an older version of GRASS GIS that will be discontinued soon. You should upgrade, and read the current manual page.
Note: This addon document is for an older version of GRASS GIS that will be discontinued soon. You should upgrade your GRASS GIS installation, and read the current addon manual page.
NAME
r.forcircular - Evaluation of circular bioeconomy level of forest ecosystemsKEYWORDS
raster, bioeconomy, forestSYNOPSIS
Flags:
- -r
- Remove all operational maps
- --overwrite
- Allow output files to overwrite existing files
- --help
- Print usage summary
- --verbose
- Verbose module output
- --quiet
- Quiet module output
- --ui
- Force launching GUI dialog
Parameters:
- forest=name [required]
- Name of input parcel parcel map
- Name of input parcel parcel map
- boundaries=name [required]
- Name of input boundaries vector boolean map
- Name of input boundaries vector boolean map
- dtm=name [required]
- Name of input elevation raster map
- tracks=name [required]
- Name of input forest roads vector map
- Name of input forest roads vector map
- rivers=name
- Name of input rivers vector map
- Name of input rivers vector map
- lakes=name
- Name of input lakes vector map
- Name of input lakes vector map
- protected_areas=name
- Name of input protected areas vector map
- Name of input protected areas vector map
- slp_min_cc=float [required]
- Percent slope lower limit for aerial extraction
- Default: 30.
- slp_max_cc=float [required]
- Percent slope higher limit for aerial extraction
- Default: 100.
- dist_max_cc=float [required]
- Maximum distance for aerial extraction
- Default: 1000.
- slp_max_fw=float
- Percent slope higher limit with Forwarder
- Default: 30.
- dist_max_fw=float [required]
- Maximum distance with Forwarder
- Default: 900.
- slp_max_cop=float [required]
- Percent slope higher limit with other techniques for Coppices
- Default: 30.
- dist_max_cop=float [required]
- Maximum distance with other techniques for Coppices
- Default: 800.
- hf_slope=string [required]
- Machineries for high forest in steep terrain
- Options: cable crane - high power, cable crane - medium/low power, skidder
- c_slope=string [required]
- Machineries for coppice in steep terrain
- Options: cable crane - high power, cable crane - medium/low power, tractor
- hf_noslope=string [required]
- Vehicle for high forest in not steep terrain
- Options: forwarder, skidder, tractor
- c_noslope=string [required]
- Vehicle for coppice in not steep terrain
- Options: forwarder, skidder, tractor
- resolution=string
- Working resolution
- Default: 10
- cost_chainsaw=float
- Felling and/or felling-processing cost with chainsaw EUR/h
- Default: 13.17
- cost_processor=float
- Processing cost with processor EUR/h
- Default: 83.52
- cost_harvester=float
- Felling and processing cost with harvester EUR/h
- Default: 96.33
- cost_cablehf=float
- Extraction cost with high power cable crane EUR/h
- Default: 111.64
- cost_cablec=float
- Extraction cost with medium power cable crane EUR/h
- Default: 104.31
- cost_forwarder=float
- Extraction cost with forwarder EUR/h
- Default: 70.70
- cost_skidder=float
- Extraction cost with skidder EUR/h
- Default: 64.36
- cost_tractor=float
- Extraction cost with tractor EUR/h
- Default: 45
- cost_chipping=float
- Chipping cost EUR/h
- Default: 160.87
- interest=float
- Interest rate EUR/h
- Default: 0.03
- mc_paper=float
- Percentage of roundwood re-use in paper
- Default: 0.02
- mc_furniture=float
- Percentage of roundwood re-use in furniture
- Default: 0.4
- mc_building=float
- Percentage of roundwood re-use in building
- Default: 0.5
- mc_woodpackaging=float
- Percentage of roundwood re-use in packaging
- Default: 0.03
- mc_other=float
- Percentage of roundwood re-use in other use
- Default: 0.05
- ind1=name [required]
- Name for indicator n.1 map
- ind2=name [required]
- Name for indicator n.2 map
- ind3=name [required]
- Name for indicator n.3 map
- ind4=name [required]
- Name for indicator n.4 map
- ind5=name [required]
- Name for indicator n.5 map
- ind6=name [required]
- Name for indicator n.6 map
- ind7=name [required]
- Name for indicator n.7 map
- w_1=float
- Weight for indicator n.1
- Default: 0.15
- w_2=float
- Weight for indicator n.2
- Default: 0.12
- w_3=float
- Weight for indicator n.3
- Default: 0.12
- w_4=float
- Weight for indicator n.4
- Default: 0.13
- w_5=float
- Weight for indicator n.5
- Default: 0.14
- w_6=float
- Weight for indicator n.6
- Default: 0.17
- w_7=float
- Weight for indicator n.7
- Default: 0.16
DESCRIPTION
r.forcircular analyzes and measures the level of sustainability of the forest-wood supply chain in a circular bioeconomy approach.NOTES
This module permits to identify potentially usable forest areas both from a technical and economic point of view. The required data input is a vector file with a series of mandatory fields described below:- incr_ha: [float] value of the forest increase [mc * ha * year-1]
- management: [integer] forest management system (form of government), can take on two values, namely (1) for forest management and (2) for coppice management
- treatment: [integer] treatment adopted, it can take on two values, namely (1) for the final use cut and (2) for the thinning. Thinning is not foreseen for coppice woods.
- roughness: [integer] level of terrain accidentality - (0): no accidentality; (1): locally bumpy; (2): partially bumpy; (3): mostly bumpy
- tree_diam: [integer] average diameter of the stems [cm]. If the data is not available, indicate the generic value 99999
- tree_vol: [decimal] average volume per plant [m3]. If the data is not available, indicate the generic value 9.999
- rotation: [integer] cutting cycle (or forest shift) [years]
- soil_prod: [integer] degree of soil productivity (fertility): (1): very low; (2): low; (3): medium; (4); tall; (5): very high
- PCI: [float] Average lower calorific value of the wood species present in the polygon [MWh / t]
- cut: [float]: cut percentage (range from 0 (0%) to 1 (100%)). It represents the percentage of wood mass on the total stock that falls during the cutting operation.
- perc_round: [float] (from 0 to 1) corresponding to the percentage of the wood mass for round wood
- perc_timb: [float] (from 0 to 1) corresponding to the percentage of the wood mass for poles
- perc_fire: [float] (from 0 to 1) corresponding to the percentage of the wood mass for firewood
- perc_res: [float] (from 0 to 1) corresponding to the percentage of wood residues to be used for energy (wood chips)
- perc_roun9: [float] (from 0 to 1) corresponding to the percentage of the wood mass for roundwood in the assortment optimization scenario
- perc_timb9: [float] (from 0 to 1) corresponding to the percentage of the wood mass for poles in the assortment optimization scenario
- perc_fire9: [float] (from 0 to 1) corresponding to the percentage of the wood mass for firewood in the assortment optimization scenario
- perc_res9: [float] (from 0 to 1) corresponding to the percentage of wood residues to be used for energy use (wood chips) in the assortment optimization scenario
- pric_roun: [float] corresponding to the average price for the roundwood assortment [€ / m3]
- pric_timb: [float] corresponding to the average price for the poles assortment [€ / m3]
- pric_fire: [float] corresponding to the average price for the firewood assortment [€ / m3]
- pric_bioe: [float] corresponding to the average price for biomass energy for energy use [€ / MWh]
- vector tracks file
- vector boundaries file
- raster digital elevetion model file
- vector rivers file
- vector lakes file
- vector protected areas file
| 4R | INDICATORS | DEFINITION |
| Reduce | i1 - Ratio (on annual basis) between annual value and annual mean
volume of harvested mass
i2 - CO2 emissions per unit of wood product |
Improving of the process efficiency reducing the utilization of natural resources |
| Reuse | i5 - Ratio between the potential economic value of the wood assortment and the real value earned | Valorisation of the valuable wood high quality assortments |
| Recover | i6 - Percentage of wood waste for bioenergy production
i7 - Amount of CO2 emissions saved per unit of energy produced by wood wastes |
Energy recovery from wood waste products; Emissions saved from energy recovery from wood waste products |
The quantification of circular bioeconomy indicators is developed in the framework of provisioning forest ecosystem services. For this reason, the indicators and results of SMCA process are computed on forest surface with financial efficiency of production process or, in other terms, the area where a positive stumpage value can be reached. The calculation of stumpage value is carried out following the approach of another GRASS GIS add-on: r.green.biomassfor.
The model in r.forcircular starts with importation of geodata and
conversion of vector intp raster. Then, through a multistep approach, the
technical and the economic availability
of biomass (both traditional wood assortments and woodchips for bioenergy
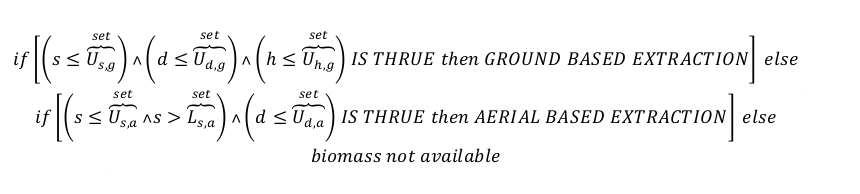
production) are quantified. Technical availability depicts forest surface
where the extraction of wood material is possible.
The approach combines type of mechanisation, limits for slope,
distance from roads and roughness.
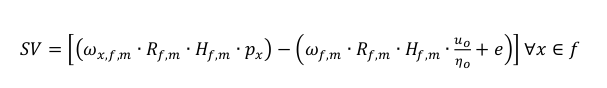
In forest area where extraction is possible, the stumpage value is
quantified as a combination of differenct factors such as
hourly unitary cost of each production process, worker costs,
hourly productivity and administrative costs.
The user can setthe upper and – if needed – lower limits for slope and
distance
from roads to obtain the technical surface:
The importance of each circular bioeconomy index derives from the work of Paletto et al. (see Paletto A, Becagli C, Geri F, et al (2022) Use of Participatory Processes in Wood Residue Management from a Circular Bioeconomy Perspective: An Approach Adopted in Italy. Energies 15:1011) where – starting from a total sample of 56 decision makers operating in forest-based sectorin Italy – 30 decision makers filled out a questionnaire. The decision makers involved in the study have been identified based on their knowledge and experience in the fields of bioeconomy, circular economic, and forest policy. According to the outputs provided by Paletto et al., the values of indices currently applied in r.forcircular (but modifiable by users) are: i1=0.15, i2=0.12, i3=0.12, i4=0.13, i5=0.14, i6=0.17, i7=0.16.
r.forcircular highlights the output in both numerical and
geographical format. By means of zonal statistics operations following
results can be reported for the forest surface where stumpage value is
greater then 0: annual availability of assortments (m3/y)
recalibrated in category of harvested material (i.e., roundwood, timber
pole, firewood, woodchips converted in bioenergy and expressed in MWh/y),
annual stumpage value (€/y), average annual stumpage value
(€/ha·y-1), average stumpage value at harvesting
(€/ha) and avoided CO2 emissions (tCO2/y).
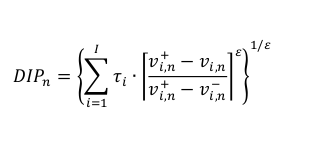
Quantification of circular bioeconomy is expressed by a SMCA procedure based
on compromise programming (CP) technique. CP depicts the distance from the
so-called “ideal” point, a hypothetical alternative defined as the most
suitable level for each indicator (i) in the considered scenario.
The distance from ideal point (DIP) is measured with the decision rule:
EXAMPLE
This example is based on the case-study of Municipality Union of the Sieve and Arno valleys (province of Florence, Tuscany, Italy). The territory is mountainous and is located in the central Apennine. The surface of Municipality Union is 49,500 hectares with a forest index of 62%. Woodlands are mainly composed by broadleaved forests (84%), followed by conifers (10%) and mixed forests of broadleaved and conifers (6%). Below you can see the vector parcel file, with a field structure like the manatory field scheme described above.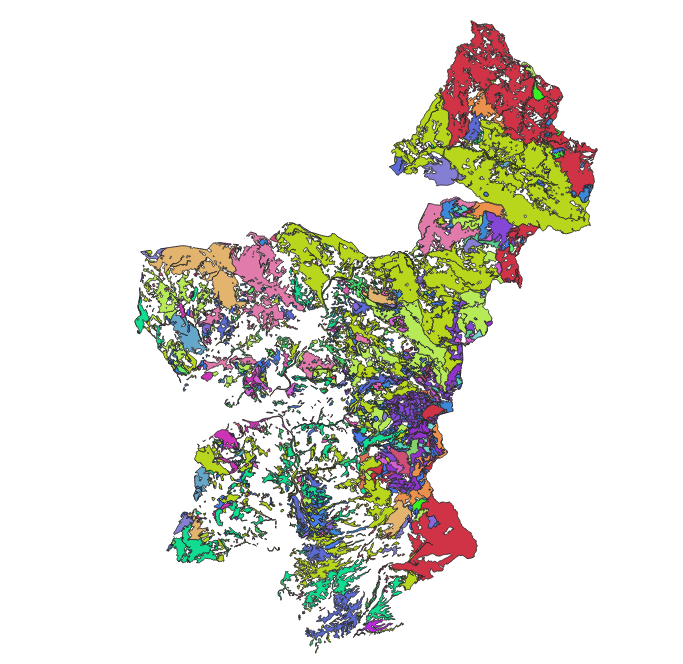
Parcel map
r.forcircular forest=parcel boundaries=study_Area dtm=dem tracks=forest_tracks \
  rivers=rivers lakes=lakes protected_areas=reserved slp_min_cc=30. slp_max_cc=100. \
  dist_max_cc=1000. dist_max_fw=900. slp_max_cop=30. dist_max_cop=800. \
  hf_slope="cable crane - high power" c_slope="cable crane - medium/low power" \
  hf_noslope="tractor" c_noslope="tractor" ind1=indicator1 ind2=indicator2 ind3=indicator3 \
  ind4=indicator4 ind5=indicator5 ind6=indicator6 ind7=indicator7
The output maps are: technical_surface (forest surface where exploitation is
technically possibile), economic_surface (forest surface where the exploitation
is economically advantageous), emission (CO2 produced by the
exploitation), annual_avoided_emission (emissions avoided compared to the use of
fossil fuels), revenues (map of economic revenues), dip (distance from ideal,
the assessment of the circular economy level of the forest supply chain).
Below there are two examples of the output maps corresponding respectively to
the
stumpage value and the annual avoided emission:
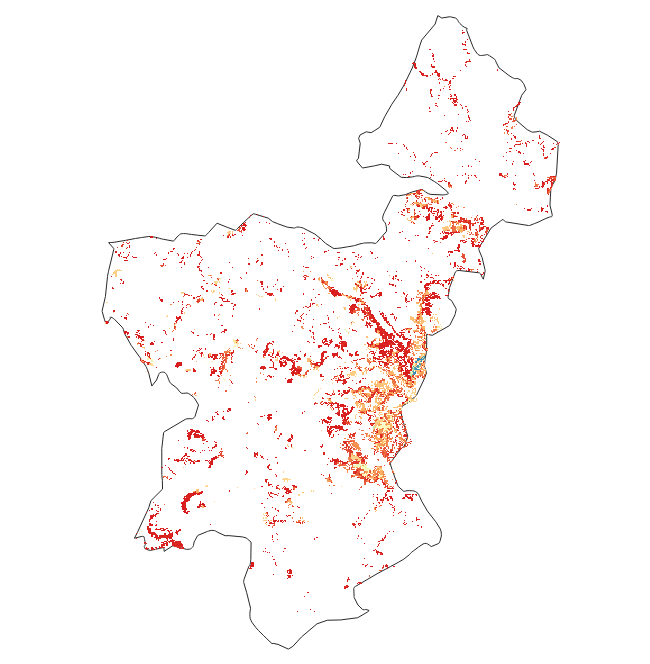
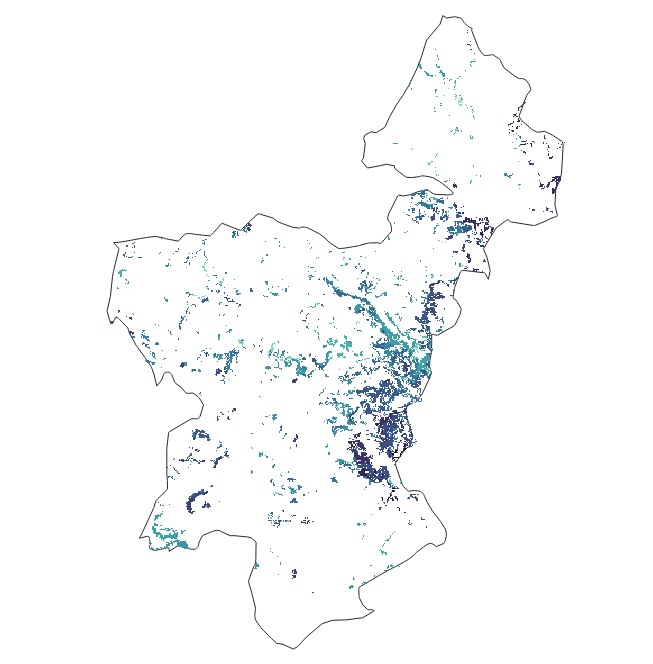
Examples of output maps: stumpage value and avoided emission
#############################
End of process
Name of output maps:
rep_roundwood -> roundwood (m3/y): 8507.3917
rep_timber -> timber pole (m3/y): 195.4894
rep_firewood -> firewood (m3/y): 7239.1150
rep_bioenergy -> bioenergy (MWh/y): 6354.3441
rep_sum_a_stumpage_value -> annual stumpage value (EUR/y): 147608.5463
rep_ave_stumpage_value -> average stumpage value (EUR/ha): 3998.2780
rep_ave_a_stumpage_value -> average annual stumpage value (EUR/ha*y-1): 28.2872
rep_annual_avoided_emission -> annual avoided emissions (t): 1963.9961
---------------------------
rep_indicator1 -> annual value of wood on annual yield (euro/m3): 7.2534
rep_indicator2 -> carbon dioxide emission per cubic meter (t/m3): 0.0001
rep_indicator3 -> general index of forest surface utilization (ha/y):157.192
rep_indicator4 -> general index of re-use (m3*y) sum: 292481.3438
rep_indicator5 -> potential value of wood on real value (euro/euro): 1.3093
rep_indicator6 -> percentual of wood residuals used in bioenergy production (%): 0.1277
rep_indicator7 -> avoided CO2 per unit of energy produced (gCO2 /kWh): 308.6331
dist_tot -> AMC map: 3.7276
#############################
REFERENCE
Paletto A, Becagli C, Geri F, Sacchelli S, De Meo I. Use of Participatory Processes in Wood Residue Management from a Circular Bioeconomy Perspective: An Approach Adopted in Italy. Energies. 2022; 15(3):1011. https://doi.org/10.3390/en15031011SEE ALSO
r.green.biomassforAUTHORS
Francesco Geri and Sandro SacchelliSOURCE CODE
Available at: r.forcircular source code (history)
Latest change: Friday Feb 11 21:31:26 2022 in commit: 25940d78f4ffbf9b35495209f50bb7765db78fa1
Note: This document is for an older version of GRASS GIS that will be discontinued soon. You should upgrade, and read the current manual page.
Note: This addon document is for an older version of GRASS GIS that will be discontinued soon. You should upgrade your GRASS GIS installation, and read the current addon manual page.
Main index | Raster index | Topics index | Keywords index | Graphical index | Full index
© 2003-2023 GRASS Development Team, GRASS GIS 7.8.9dev Reference Manual