Note: This document is for an older version of GRASS GIS that has been discontinued. You should upgrade, and read the current manual page.
NAME
d.vect.colhist - Draws the histogram of values in a vector attribute columnKEYWORDS
display, vector, geologySYNOPSIS
Flags:
- --overwrite
- Allow output files to overwrite existing files
- --help
- Print usage summary
- --verbose
- Verbose module output
- --quiet
- Quiet module output
- --ui
- Force launching GUI dialog
Parameters:
- map=name [required]
- Name of vector map
- Or data source for direct OGR access
- layer=string
- Layer number or name
- Vector features can have category values in different layers. This number determines which layer to use. When used with direct OGR access this is the layer name.
- Default: 1
- column=name [required]
- Attribute column containing azimuth
- where=sql_query
- WHERE conditions of SQL statement without 'where' keyword
- Example: income < 1000 and population >= 10000
- plot_output=name [required]
- Name for graphic output file for plot (extension decides format, - for screen)
- Name for output file
- Default: -
- bins=integer
- Number of bins in histogram
- Default: 30
Table of contents
DESCRIPTION
d.vect.colhist draws a histogram of the values in a vector map attribute column. The user use the where option to only select a subset of the attribute table and can determine the number of bins (bars) used for the histogram. The plot_output parameter determines whether the result is displayed on screen (default) or exported to a graphics file.
NOTE
This is a quick and dirty solution using basic matplotlib. In future, this should be integrated into the g.gui, possibly together with the raster histogram tool.
EXAMPLE
Show the histogram of median age values in the census block map:d.vect.colhist map=censusblk_swwake column=MEDIAN_AGE where="TOTAL_POP>0"
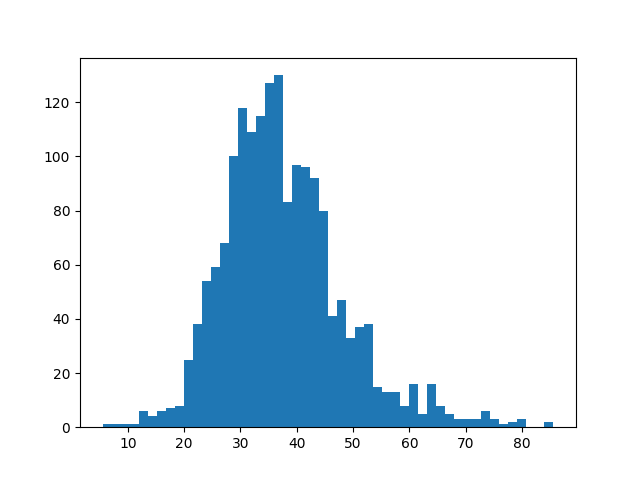
Histogram of median age values of census blocks
AUTHOR
Moritz LennertSOURCE CODE
Available at: d.vect.colhist source code (history)
Latest change: Monday Jun 28 07:54:09 2021 in commit: 1cfc0af029a35a5d6c7dae5ca7204d0eb85dbc55
Main index | Display index | Topics index | Keywords index | Graphical index | Full index
© 2003-2023 GRASS Development Team, GRASS GIS 7.8.9dev Reference Manual